Monitor Ports
Lighthouse allows users with the appropriate permissions to view ports on a node to get a quick snapshot of the health of the nodes. For example, to trace a fault on a node, a network engineer will want to investigate the latest logs for a port.
-
Select MONITOR > Nodes. A list of nodes displays, each node displays the total number of ports/configured ports.
-
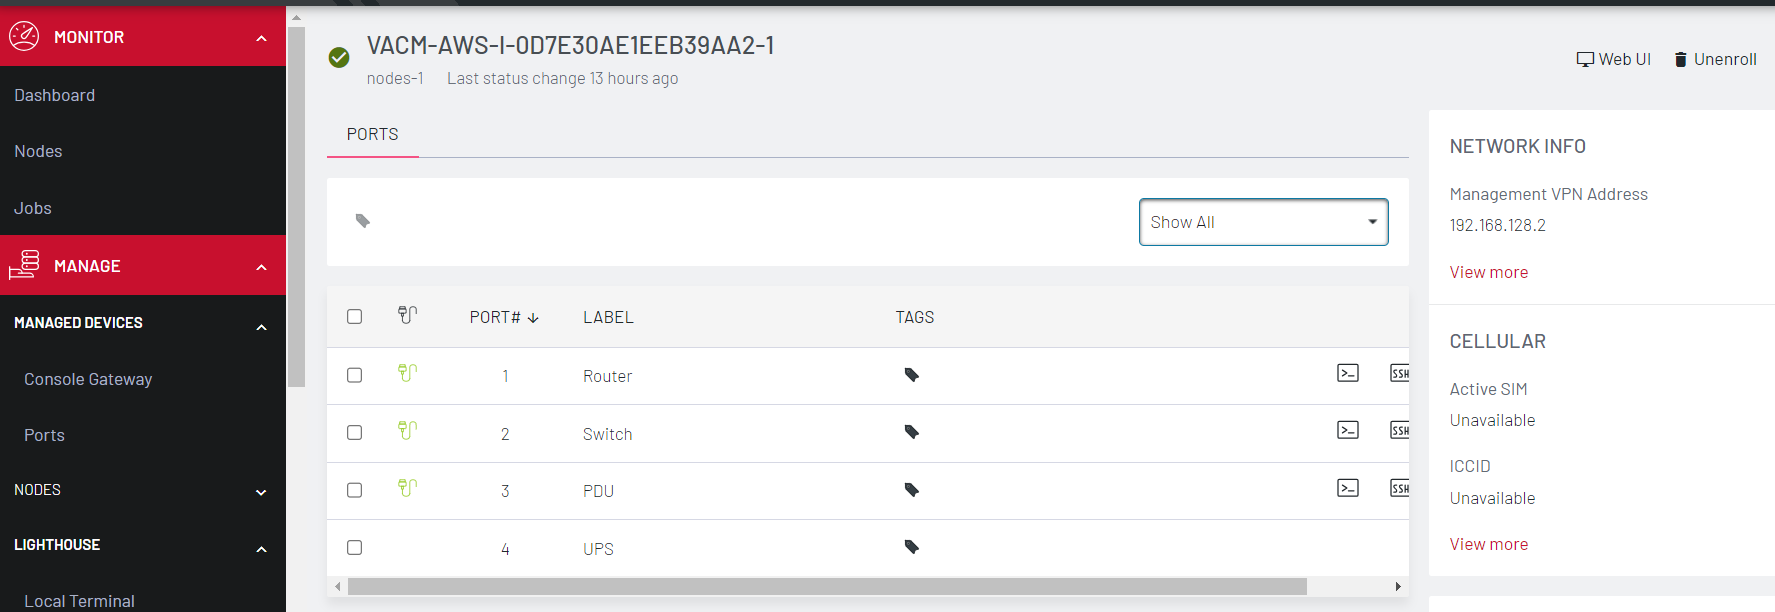
Click on the required node. The Node page displays node information including sortable lists of Configured Ports and Unconfigured Ports, Network Info, Cellular details, Node tags and Node details.
-
The drop down allows you to select to Show All, Configured Ports, or Unconfigured Ports on the node.
-
If the node has been configured to display logs, and you have the correct permissions you can select Port Logs.
-
The Port Logs page displays.
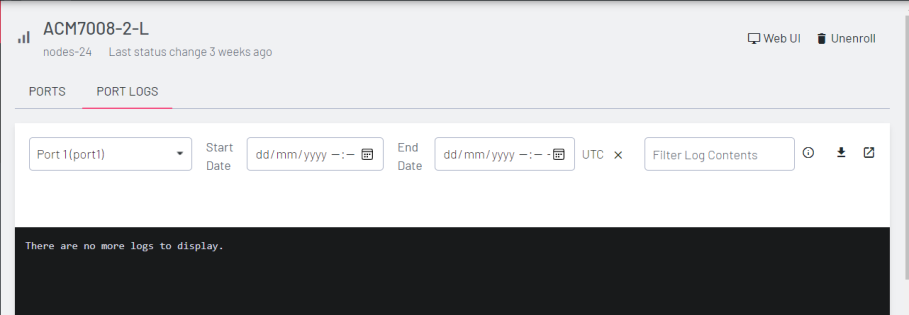
Select the Port from the list, and specify the date range (Start Date and End Date) to view the logs that display in the log window below. You can also access the web terminal and SSH of each connected device. -
Alternatively, you can search for a log with a particular text, using the Filter Log Contents Logs matching the search parameter display in the log window.
-
You can also download the displayed logs, or open a new window to view the logs in more detail.