Dashboard Page
The Dashboard page is displayed in the Main Pane by default when you log in to Lighthouse. To navigate to this page from elsewhere in Lighthouse, in the Menu Pane, select  Dashboard.
Note: If you do not have permission to view nodes, the Dashboard displays as a blank page.
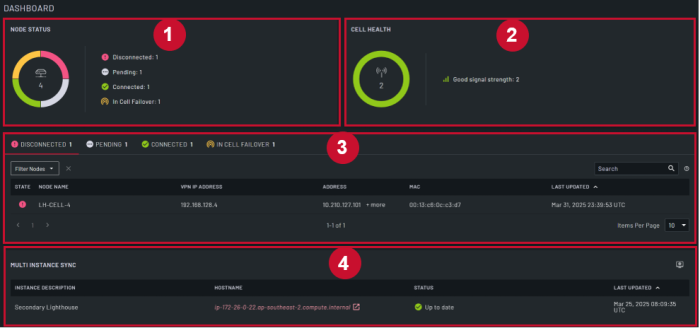
This page displays an overview for the Lighthouse instance that shows the current status of the nodes and the cell health.
The Dashboard page consists of the following sections:
| Item |
Section |
Description |
| 1 |
Node Status |
This section displays node status. Each status is represented by a color in the donut. When you hover your mouse over a specific color, the number of nodes in that status displays.
- Disconnected: Nodes that are disconnected due to losing a connection to Lighthouse, represented by the color red.
- Pending: Nodes that are pending approval, represented by the color gray.
- Connected: Nodes that are connected, represented by the color green.
- Failed Over: Nodes that are connected to Lighthouse with cell failover, represented by the color yellow.
|
| 2 |
Cell Health |
Note: You must enable cell health reporting for this section to be visible.
This section displays the cell health of the nodes. Each health status is represented by a color in the donut. When you hover your mouse over a specific color, the number of nodes in that health status displays.
- Bad signal strength: Represented by the color red.
- Moderate signal strength: Represented by the color yellow.
- Good signal strength: Represented by the color green.
- SIM Issues: Represented by the color red.
- Test Failed: Represented by the color red.
- Data Syncing: Represented by the color grey.
|
| 3 |
Detailed Node Status |
This section displays more details for the nodes in each status. It displays the following tabs:- Disconnected: This tab displays information for all nodes that are disconnected.
- Pending: This tab displays information for all nodes that are pending approval. To approve or unenroll:
- multiple nodes, select the check boxes next to the nodes you want to approve or unenroll, then click Approve Selected or Unenroll Selected.
- all pending nodes with the same action, select the check box in the header, then click Approve Selected or Unenroll Selected.
- individual nodes, click the
 Approve or Approve or  Unenroll button for the specific node. Unenroll button for the specific node.
- In Cell Failover: This tab displays information for all nodes that are connected to Lighthouse via failover.
- Connected: This tab displays information for all nodes that are connected. You can click on the:
- Node Name for a specific node to open the Node Details page.
- Cell Status for a specific node to open the Cellular Health Details for [Node Name] dialog.
- Access Web UI icon to access the web UI for the selected node.
For all tabs, you can: - Use the Items Per Page drop-down to set the number of nodes that display.
- Click the chevron on the Last Updated column to order the nodes by last modified date.
- Use the Search box to search for nodes.
- Use the Filter Nodes drop down to filter the nodes with an existing filter or create a new node filter.
|
| 4 |
Multi Instance Sync |
This section displays all secondary instances that are enrolled into the primary. You can click on the:- Hostname to open the Web UI of the secondary Lighthouse.
- Click on
 Configure Secondary Lighthouses to open the SECONDARY LIGHTHOUSES page where you can Set up a Multi Instance. Configure Secondary Lighthouses to open the SECONDARY LIGHTHOUSES page where you can Set up a Multi Instance. - Chevron on the Last Updated column to order the instances by last modified date.
|