Dashboard Page
The Dashboard page is displayed in the Main Pane by default when you log in to Lighthouse. To navigate to this page from elsewhere in Lighthouse, in the Menu Pane, select ![]() Dashboard.
Dashboard.
Note: If you do not have permission to view nodes, the Dashboard displays as a blank page.
This page displays an overview for the Lighthouse instance that shows the current status of the nodes and the cell health.
The Dashboard page consists of the following sections:
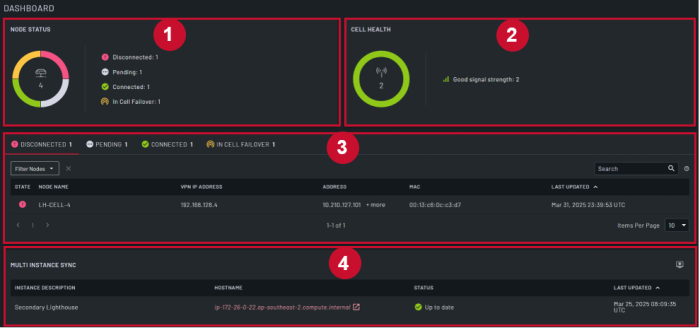
| Item | Section | Description |
|---|---|---|
| 1 | Node Status | This section displays node status. Each status is represented by a color in the donut. When you hover your mouse over a specific color, the number of nodes in that status displays.
|
| 2 | Cell Health |
Note: You must enable cell health reporting for this section to be visible. This section displays the cell health of the nodes. Each health status is represented by a color in the donut. When you hover your mouse over a specific color, the number of nodes in that health status displays.
|
| 3 | Detailed Node Status | This section displays more details for the nodes in each status. It displays the following tabs:
For all tabs, you can:
|
| 4 | Multi Instance Sync | This section displays all secondary instances that are enrolled into the primary. You can click on the:
|
 Approve or
  Unenroll button for the specific node.
 Cellular failover icon indicates the node is currently operating on a cellular connection because the primary connection is unavailable.
 Net-to-Net failover icon indicates the node is currently operating on an alternate non-cellular network because the primary connection is unavailable.
 Configure Secondary Lighthouses to open the SECONDARY LIGHTHOUSES page where you can